

17 March 2022. A guest article by Markus Raatz & Felix Wolf*
The LoRaWAN radio technology offers a wide range of applications for sensor-based IoT. Business analytics services help to analyse large volumes of data from different sources and visualise them in real time. We give an overview.
 LoRaWAN sensors transmit measured values licence-free and securely.
(Image: public domain / Unsplash)
LoRaWAN stands for Long Range Wide Area Network. The licence-free radio standard belongs to the Low Power Wide Area Network technologies, LPWAN for short. LoRaWAN transmits sensor data with very little energy, even over long distances, and offers excellent building penetration.
The sensors are simple in design, which makes them inexpensive and flexible to use. Compared with other technologies, operators can build the network infrastructure themselves. This avoids dependence on a network operator and the user keeps control of their data. A municipal utility, for example, is responsible for data security and therefore for the privacy of its citizens. LoRaWAN provides a secure basis, because the protocol works with two-level symmetric encryption and the key is never transmitted over the air.
Storing IoT data in the cloud
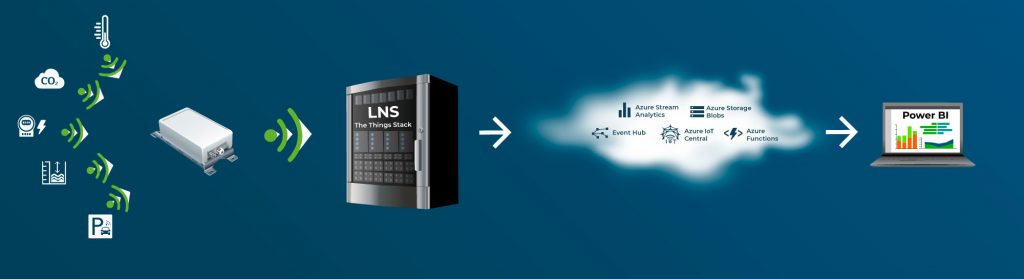
More and more companies are using a cloud for their IT resources. Many operators of a LoRaWAN-based IoT also want to store their data in a cloud and visualise it dynamically. The network server The Things Stack leads directly to Amazon Web Services (AWS), where The Things Stack AWS Launcher offers a simple solution. The cloud services of other providers such as Google, IBM, Microsoft and SAP also offer powerful data analytics and data insights services.
Microsoft has the advantage that user and permission management integrates with Active Directory and therefore works well with existing solutions such as Microsoft Office. Anyone who wants professional business applications that integrate into the existing software infrastructure should take a look at the Azure cloud. Almost all Microsoft products are designed so that their data ends up here, where analyses can be visualised in real time. Azure offers a wide range of end-user-friendly applications in many languages that can be used without the expertise of expensive specialists.
Visualising IoT data in real time
Building a data culture, enabling data-driven decisions and making it easier for business users to work with their own data: all of this is possible with self-service analytics software such as Microsoft Power BI. As soon as you want to make reports and dashboards available to other users in the web browser, you have to publish them on powerbi.com, which takes you into the Azure cloud.
In terms of licensing, Power BI and Azure are two different things. Power BI is included in Microsoft 365. Those who do not have the package currently pay 8.40 euros per user per month for a licence. Users can forward the measured values from platforms such as The Things Network to Power BI automatically. One reason to analyse your data with Power BI is its sheer volume: while Excel stops at one million rows, in Power BI the main memory is the only limit.
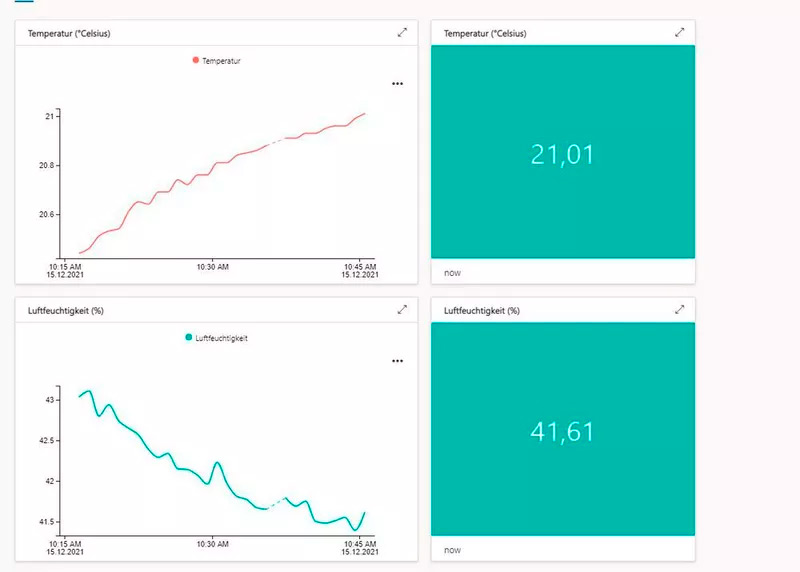
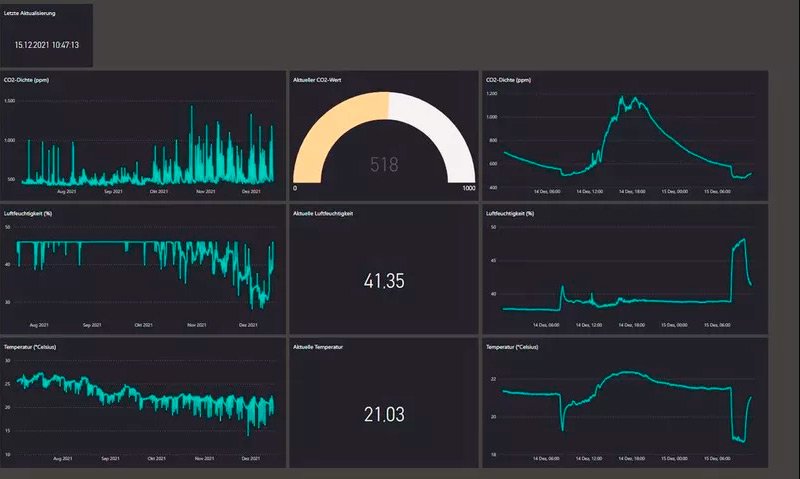
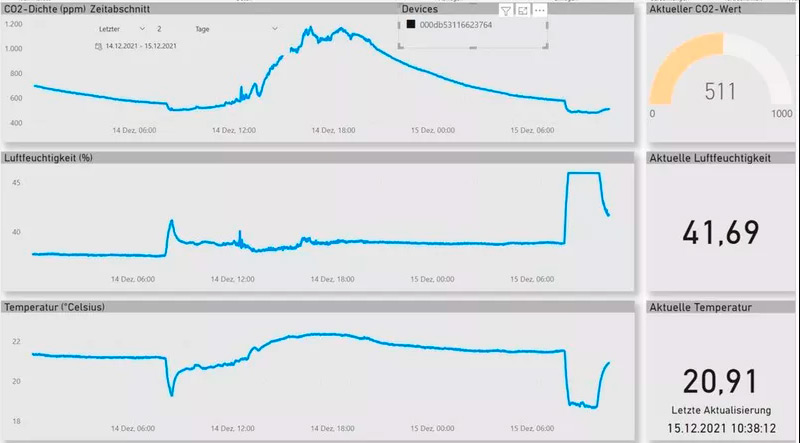
One of the nicest features is the automatically animated display of real-time streaming data in the web browser. The Power BI real-time datasets offer plenty of chart types, each of which can be configured further. If that is not enough, the community offers custom visuals.
Looking back enables predictions
Often it is not enough to watch the data of the last few hours; what matters is looking many weeks or months into the past. This makes errors from long ago just as visible as the moment known as the golden batch, when everything worked perfectly. And last but not least, AI predictions are built on historical data.
This requires gigantic amounts of data to be stored securely for the long term. Amazon has S3 Storage, Google has Google Cloud Storage and Microsoft has Azure Blob Storage. For all of them, storing huge amounts of data in file form with high availability is inexpensive: storing one gigabyte in Azure's so-called Cool Storage, which is sufficient for long-term storage, currently costs 0.00863 euros per month. Users therefore never have to delete anything from the huge amounts of data that IoT devices deliver. Everything can be collected in the cloud, true to the motto: "Today's noise is tomorrow's information."
Azure Functions: a good place for IoT measurements
If the measured values from The Things Stack are to go into the Azure cloud, the way leads via custom webhooks. In Azure, the data is in good hands in the inexpensive and flexible Azure Functions component. These are serverless functions that you have to develop yourself, using programming languages such as Java, C#, JavaScript or PowerShell, so some scripting knowledge is required.
Azure Functions are comparable to Google Cloud Functions and AWS Lambda. The advantage of such serverless routines is that they are built to be triggered by events, whereupon they execute a piece of code and terminate again. The cost of each call is billed individually in the form of microbilling. If thousands of events suddenly occur, the infrastructure behind them scales up transparently and dynamically.
IoT Central and IoT Hub: for home-grown solutions
One of the most exciting solutions that can be fed with real-time data via an Azure Function is Azure IoT Central. The SaaS solution provides a simple portal, the IoT Central Application, with which business users can also build professional IoT systems. A great deal can be done with the data coming from the devices without writing a single line of code: rules can be defined that start actions, and the data can be written to Blob Storage for permanent storage. A simple reporting system is also available.
Dashboards in IoT Central are not spectacular, but they are easy to build. This means almost anyone in the company can connect devices, monitor them and visualise data. IoT Central is a simple graphical interface with only some of the capabilities that the IoT Hub offers. Among other things, the IoT Hub makes it possible to update and manage device software centrally. Its top feature is the ability to open a return channel from the IoT Hub to the device. However, this comes at a price: the free version can receive a maximum of 8,000 messages per day and manage a maximum of 500 devices. Beyond that, prices rise with scale.
Event Hub: high data throughput for real-time streaming
The Event Hub is also a component of the IoT Hub that can be used on its own. The tool offers high data throughput for real-time streaming on the web with very good scalability. Here we are talking about big data, because the Event Hub can handle billions of requests per day.
But even for a few hundred messages it can be worth including it in the architecture. In this case the tool is very inexpensive, and many other tools from the Microsoft IoT portfolio connect to it directly, such as Databricks, Stream Analytics, Azure Data Lake Store and HDInsight. Another practical feature: with Event Hub Capture, the data of all incoming events can be written in parallel to inexpensive Blob Storage, where it is ready for archiving or long-term analysis.
Azure Stream Analytics: for the data-frugal
Not every user needs the many billions of messages per day that the Event Hub can forward. Often every message matters, but what you want to extract from the data stream are aggregate values over a time window: What is the average temperature of the last five minutes? What are the maximum and minimum values for each quarter of an hour?
This is exactly the complex event processing that Stream Analytics offers. The queries run on the incoming data stream without holding it up, and the aggregate values resulting from the query can be forwarded, containing only meaningful summaries. The output types are very open and varied: Blob Storage, SQL Database or Azure Synapse Analytics, Cosmos DB, Service Bus or Azure Functions, and above all Power BI for the graphical, animated display of the data in real time.
This guest article by Markus Raatz (Ceteris AG) and Felix Wolf (Alpha_Omega Technology) was published in Industry of Things and BigData Insider.